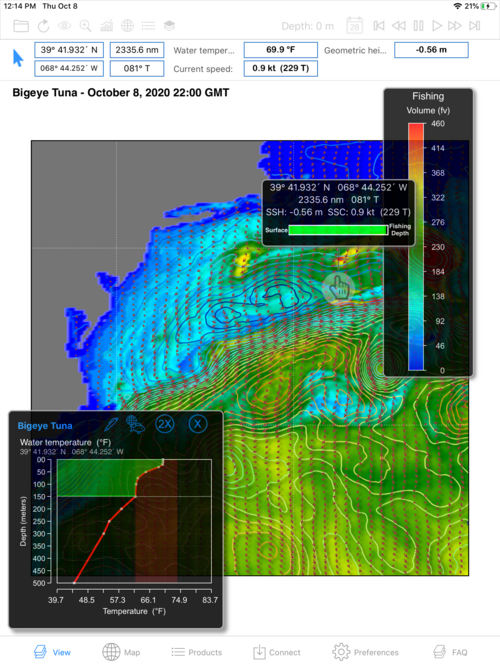
4.1.4.6. FishMap
We could stop right there and have an amazing fish finding tool. But we don’t stop!
By moving your cursor around you can inspect your fishing area and assess accessible Fishing Volume and Mixed Layer Depth point by point. But what if you then had a means of assessing how Fishing Volume and thus fishing opportunity changes across the whole field of the GRIB you downloaded? In one picture! A means of integrating not only across the ocean but also looking vertically ‘into’ the ocean? That summarized this in one color-coded picture highlighting how the fishing volume for your target and your boat/gear changes in the whole ocean around you?
We’ve done that... This is the Fish Map.
Click on the icon above your Thermocline graph that looks like a fish. Three things happen:
1) Your background water temperature grib is replaced by a new rendering, the FishMap,
2) The temperature palette is replaced by a Fishing Volume palette and
3) An OTD meter appears in your cursor tracking graphic.

Let’s explain each of them:
1) The background rendering now depicts the same area of the ocean that you have been looking at with your background GRIB and the Thermocline chart. Except that now we are no longer looking at the temperatures themselves but instead the amount of water containing target temperatures positioned above your maximum fishing depth. Again, and this is important, even though they are color-coded, these are NOT temperatures. The colors are Fishing Volumes. In one step, SAGA has swept through your background GRIB at ALL depth levels, calculated the Fishing Volume bar we described above and adjusted it for your Maximum Fishing Depth, at each of those points. It then color coded the volumes it came up with and plotted them as the FishMap;
2) The fishing volumes in the FishMap are shaded from cold blue to hot red. Find the Fishing Volume palette and notice how as the colors move towards red, the Fishing Volumes increase. In short, your eye is quickly drawn to the bright yellows and reds in the Fishing Map because those areas of the ocean contain more water at your target temps and depths than do the areas shaded green and blue.
3) The OTD meter in your cursor tracking graphic provides another quick means of assessing fishability. Notice that the horizontal OTD meter says Surface at its left end and Fishing Depth (the depth you have set for your gear) at the right end of the meter. As you move your cursor around the FishMap, the amount and position of the green in the OTD meter changes.
a) If your target species temperatures extend from the surface all the way to the fishing depth, then the OTD meter will be all green.
b) If the temperatures start at the surface and go down to a certain depth than the green will start from the left and extend to the right; or c) Target temperatures may be at depth and extend upwards but not quite to the surface. Then the green bar moves from the right to the left. With this meter we are trying to provide 3-D insights from a 2-D rendering.