4.1.4.2. Target Species Optimum Temp at Depth
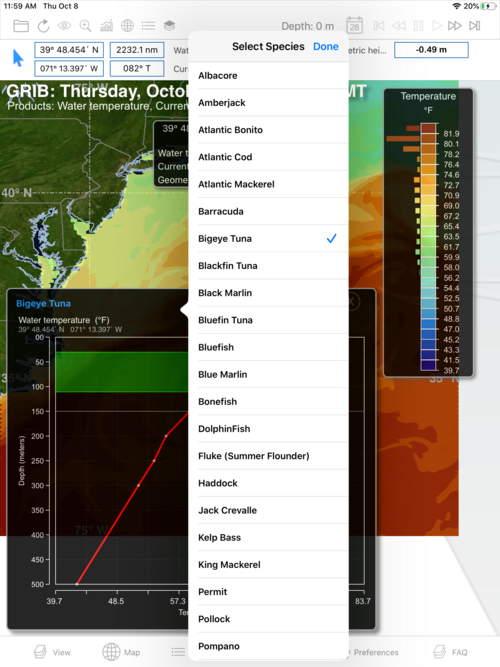
SAGA provides additional insight into your analysis of the water column. Look above the red Thermocline and to the upper left corner of the Thermocline box (above the word Water Temperature). You should see the name of a fish species there. Tap on it to see a list of 40 fish species.

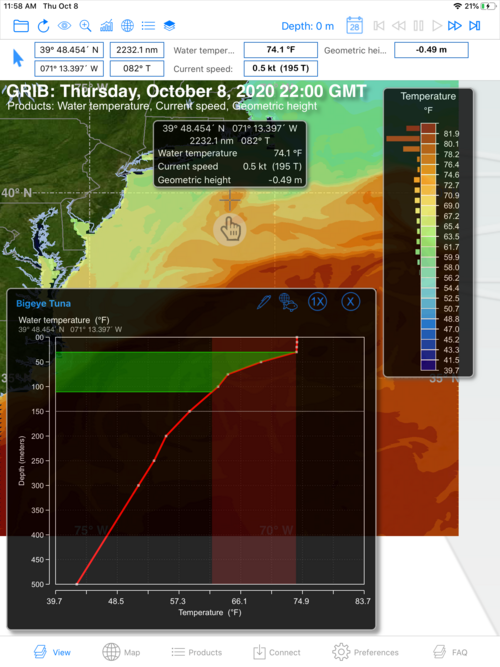
Select the Fish Species you are targeting; lets use Bigeye Tuna in this example. Once we select Bigeye, a subtle shaded vertical column appears in the grid behind the red Thermocline line which we will call the Optimum Temperature (FishOT) range. You will notice that the location of this column will move right or left in the graph depending on what species you have selected. It is showing you the temperature range favored by the species you have selected.

Move your cursor back into the grib. If there are temperatures in the grib favored by your target you will all of a sudden see a green, horizontal bar extending from the vertical depth axis on the far left to the right until it reaches the Thermocline curve. We’ll call this bar the Optimum Temperature at Depth or OTD bar. The upper edge of the OTD bar is equal to the maximum temperature for your target species and it is positioned to show you the depth at which this temperature occurs in the ocean underneath your cursor. Similarly, the lower edge of the OTD bar represents the minimum temperature for your target species and the depth at which that minimum temperature is located. In short, this horizontal bar shows you the depths at which the optimum temperatures for your target species exist in the ocean at the position of your cursor.