4.1.4. Thermocline
Sub-Surface Temperatures and FishMap with Thermocline
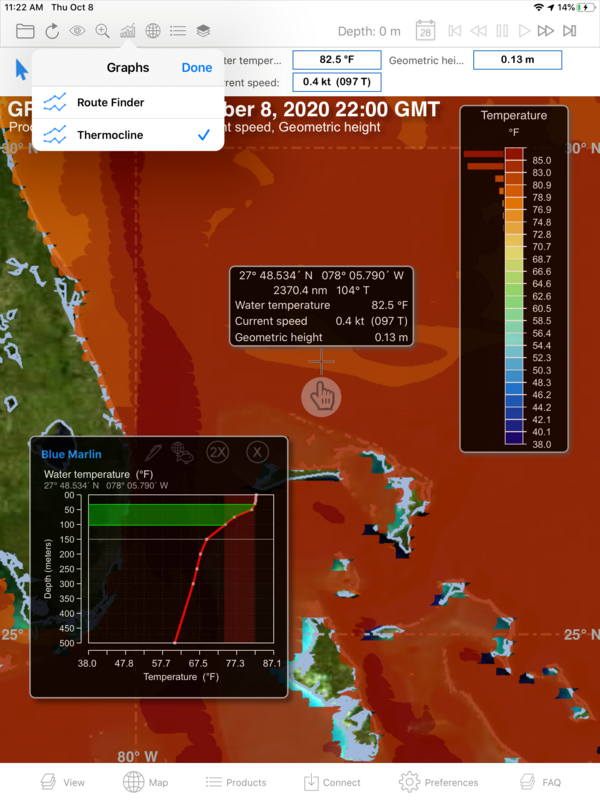
The Thermocline tool is found under the Graphs icon on the View page of SAGA. It only appears when you have selected and downloaded the preconfigured Fishing Thermocline product suite on the Products page.
Once you have launched the Thermocline tool, you see a grid with depths along the vertical axis dropping from the surface to the deepest layer of the Thermocline grib you just downloaded.

Depths are presented in meters or feet depending on your preference (you can change units by going to Preferences page in SAGA and selecting the Units and Formats menu). Below the grid are temperature values. These are the full range of temperatures present across ALL the temperature layers in your Thermocline.
Now grab the finger pointer and begin to move it around the GRIB file in the background. Do you see the red line which appears immediately inside the grid? This is the Thermocline. Looking at it closer you see it’s the change in temperature (look at the temperature scale below the graph) as a function of depth (#’s along the side).